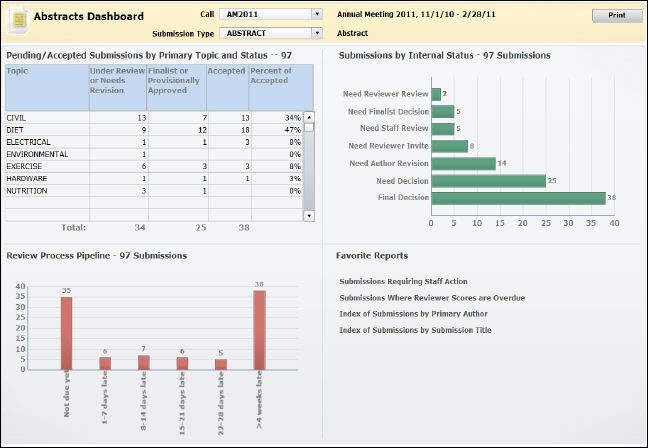
The Abstracts dashboard analyzes data from the Abstracts module with data provided by the Abstracts Call & Submission universe as well as the Abstracts Submission & Reviews universe. The results appear in a variety of charts and graphs and outline various categories such as Pending/Accepted Submissions by Primary Topic and Status, Submissions by Internal Status, Review Process Pipeline, and Favorite Reports.

The information displayed on the dashboard is based on the options you choose from the Call and Submission Type drop-down at the top toolbar.

The Call drop-down includes every Call for Participation entered in the Abstracts module. You can only view information for one call at a time. Select the call for participation from this drop-down to determine which call you want to view the analytics for. The title of the selected call, as well as the start and end dates of the call, are displayed to the right of the drop-down.
The Submission Type drop-down includes every Submission Type created within the Call for Participation you previously selected from the above Call drop-down. You can only view information for one submission type within the selected call for participation. Select the submission type from the second drop-down to determine which submission type you want to view the analytics for. The title of the selected submission is displayed to the right of the drop-down.
The Abstracts dashboard has various sections with different analytics that provide a snapshot of your association’s current Abstracts module. Below is a description of each analytic and how to work with the information within it.
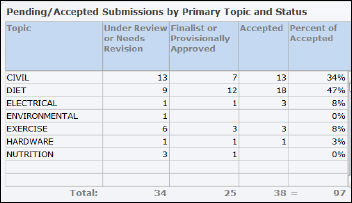
One concern for an abstracts manager is that there are enough abstracts covering the desired range of topics.
The Pending/Accepted Submissions by Primary Topic and Status section displays a list of each topic, as well as the number of each of the following statuses: Under Review or Needs Revision, Finalist or Provisionally Approved, Accepted, and Percent of Accepted. The totals of each status are displayed below the appropriate column. The data displayed is based on the status of the call and submission type you select from the drop-downs at the top of the dashboard.
Another concern for an abstracts manager is that submissions continue to move through the review process in a timely manner.
The Submissions by Internal Status section displays a bar graph showing a breakdown of how many submissions need what type of action. The data displayed is based on the status of the call and submission type you select from the drop-downs at the top of the dashboard.
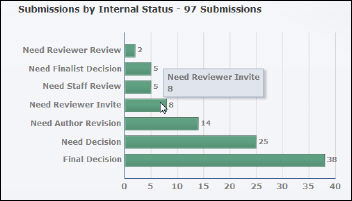
To view the exact value for a specific action needed, hover your mouse over the corresponding bar.
The key to making sure that submissions progress through the review process in a timely manner is monitoring the review pipeline and being able to identify reviewers who are late submitting scores.
The Review Process Pipeline section displays a bar graph showing a breakdown of six “aging buckets’ for reviews: Not due yet, 1-7 days late, 8-14 days late, 15-21 days late, 22-28 days late, and >4 weeks late. The data displayed is based on the status of the call and submission type you select from the drop-downs at the top of the dashboard.
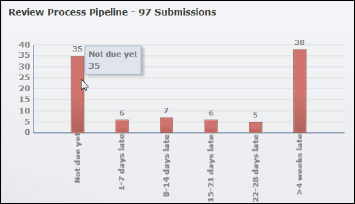
To view the exact value for each aging bucket, hover your mouse over the specific slice.
Click on the link to open the report in a new window.
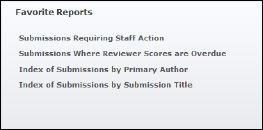
The reports in this section can be configured based on your favorite reports. Please see Configuring your Favorite Data Analyzer Webi Reports for more information.
The Favorite Reports section displays the following list of reports:
· Submissions
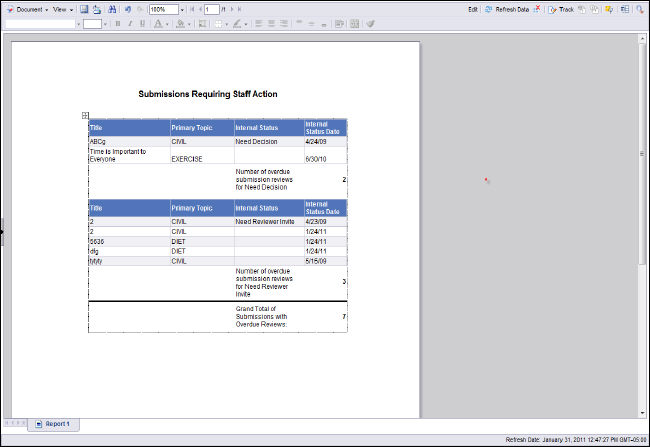
Requiring Staff Action
This report displays a list of overdue submission reviews by Primary Topic
and Internal Status.
· Submissions
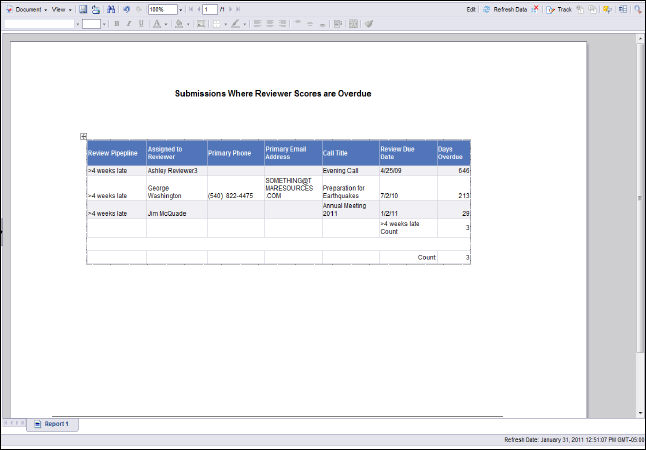
Where Reviewer Scores are Overdue
This report displays a list of submissions that are overdue by the selected
date.
· Index
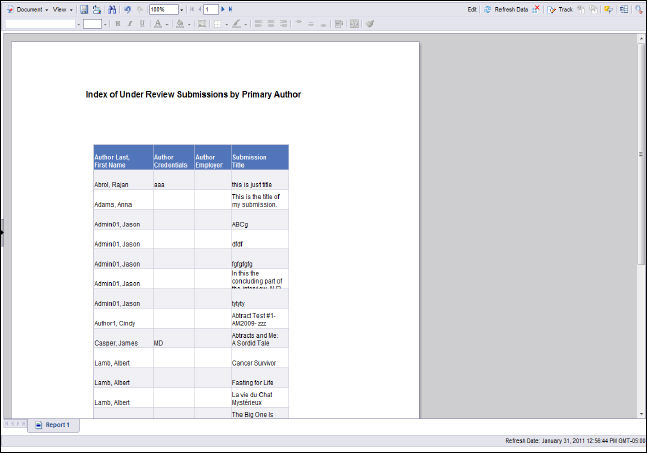
of Submissions by Primary Author
This report displays a list of submissions for the selected external status
code, call code, and submission type by primary author.
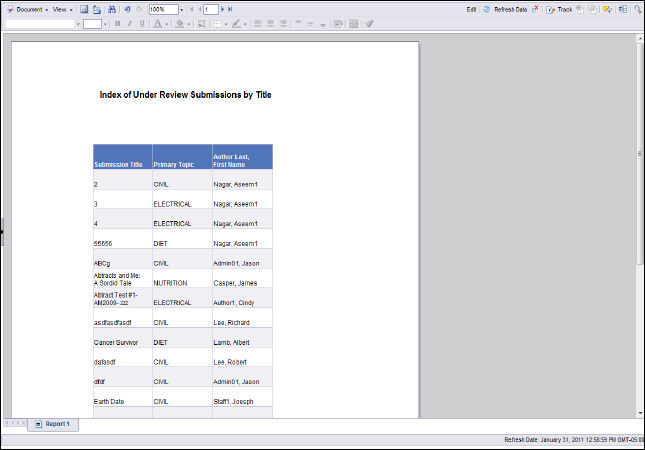
· Index
of Submissions by Submission Title
This report displays a list of submissions for the selected external status
code, call code, and submission type by submission title.
· Dashboard Data Source Reports
The Abstract Dashboard gets its data from the Webi reports (also called documents) listed below, which all get data from the Abstracts Submissions & Review universe. The destination cells in the Xcelsius worksheet, into which the data from the Webi reports (also called documents) is mapped, are shown in the Maps to… column.
| Document Name | Universe Name | Maps To . . . |
|---|---|---|
ABS Favorite Reports_xml |
Abstract Submissions & Reviews |
Maps to Fourth quadrant for Favorite Reports |
By Primary Topic_xml |
Abstract Submissions & Reviews |
Maps to First quadrant for submissions by Primary Topic and Status |
By Review Process_xml |
Abstract Submissions & Reviews |
Maps to Third quadrant for submission review process pipeline |
Call List_xml |
Abstract Submissions & Reviews |
Maps to the Call drop down |
Staff Action Needed_xml |
Abstract Submissions & Reviews |
Maps to the Second quadrant for submission requiring staff action |
Submission List_xml |
Abstract Submissions & Reviews |
Maps to the submission type drop down |