The Meeting dashboard analyzes the Meeting module with data provided by the Meeting universe. The results appear in a variety of charts and graphs and outline various categories such as Current Number of Registrants, Current Number on Waitlist, Session Registration Status, and Registration by State.
To modify the data displayed on the Meeting dashboard,
open the XML query specific to the Meeting dashboard in Data Analyzer.
You can alter the criteria for the report to change the data that transfers
to the dashboard. The XML queries for the Meeting dashboard appear in
the Data Analyzer folder found at the following file path:
Public Folders > Personify 741
> Dashboard > Meeting > XML Queries
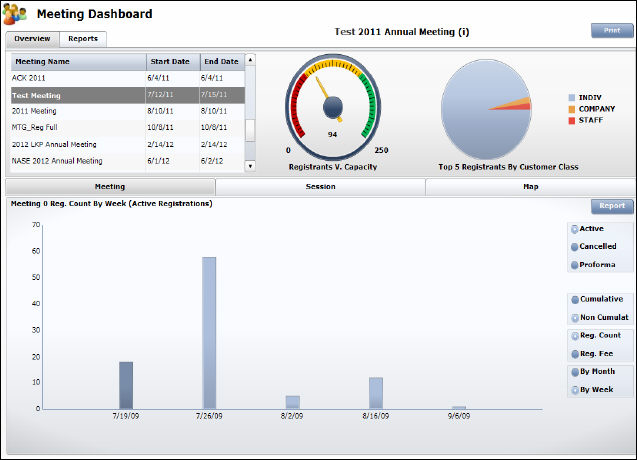
The Meeting dashboard has various sections with analytics that provide a snapshot of the Meeting module.
The Overview tab provides a list of meetings, including start and end date. The gauge represents meeting capacity goal versus active registrants. The number inside of the gauge represents the number of active registrants; whereas, the number to the right of the gauge represents the capacity goal. The color of the needle on the gauge changes according to its position within the gauge. The pie chart to the right represents the top five registrants by customer class.
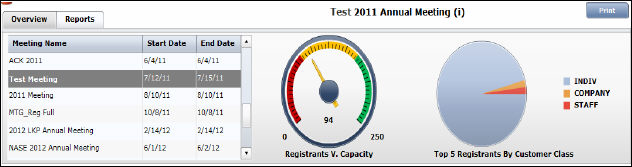
The Reports tab displays a list of reports you selected
as your favorites with a quick link to open them in another window. To
view the favorite reports, select the Reports tab next to Overview. Select
the appropriate report and click View to see the entire report.
Please see Configuring
your Favorite Data Analyzer Webi Reports for more information.
The Meeting tab provides information regarding the various registration status (Active, Canceled, Proforma, Waitlisted) for the selected meeting with a cumulative/non cumulative count or revenue total by month or by week. The registration status varies depending on the meeting selected.
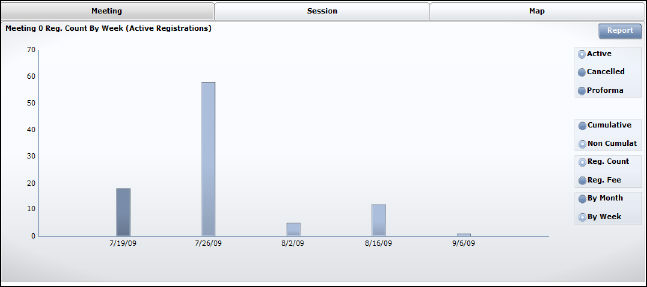
You can alter what information you view in the chart by selecting from the radio buttons on the right side of the screen. You can analyze the selected meeting to view the Non Cumulative vs. Cumulative registration count or registration fee, by month or by week, for the selected status (Active, Canceled, or Proforma).
To view the exact number for each bar, hover your mouse over the appropriate
bar in the graph.
The Session tab provides information regarding the distribution of the registrations to various sessions of the selected meeting classified by the session registration status (Active, Canceled, and Proforma). The session registration status varies depending on the meeting selected.
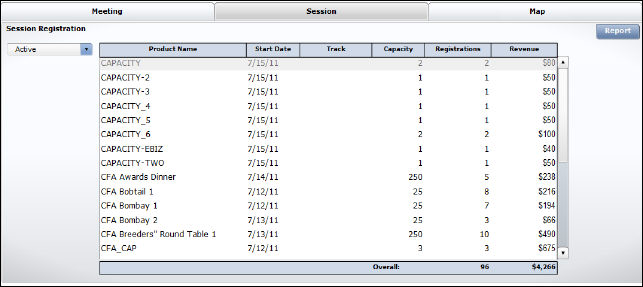
You can view count and revenue information for different types of registration statuses (Active, Canceled, or Proforma) by selecting the status from the available drop-down.
To view the exact number for each bar, hover your mouse over the appropriate
bar in the graph.
The Map tab displays a map of the contiguous United States with states color-coded depending on the number of registrations from each state for the selected meeting (see legend for more information). The list to the left of the map displays registration by US state. The list to the right of the map displays registrations by country.
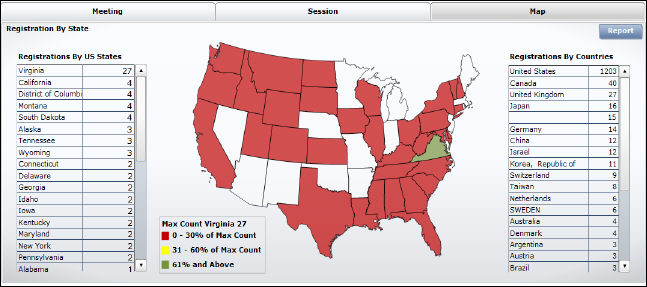
You can also hover your mouse over a specific state to view the exact number of registrations from that state.
Linking the dashboard data to reports further enhances analysis of the selected meeting to the registrant level and drilling to various levels by modifying the associated reports. You can view the list of registrants that make up a part of a chart, graph, or map for any information displayed on the Meeting dashboard by selecting the specific bar in a graph, piece of a pie chart, or state within the analytic and clicking Report in the lower half of the dashboard.
The reports that launch as Dashboard reports for the Meeting dashboard are the following:
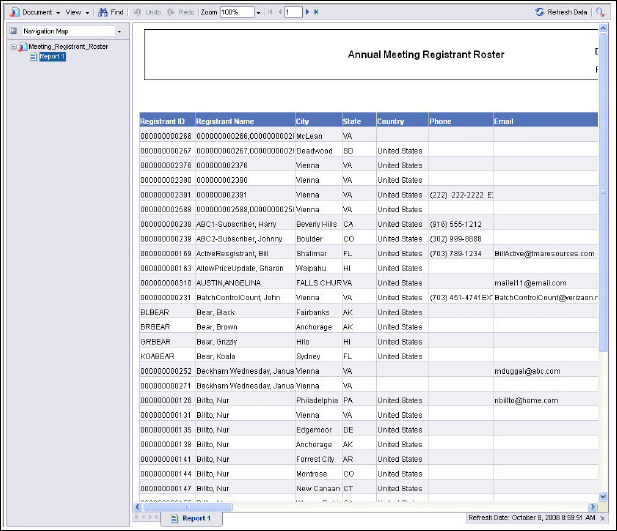
· Meeting
Registrant Roster
This report displays the total registrants for the selected meeting.
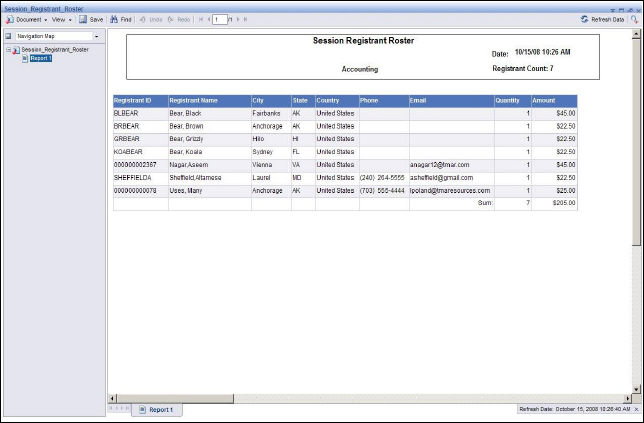
· Session
Registrant Roster
This report display the total registrants for the selected meeting and
session.
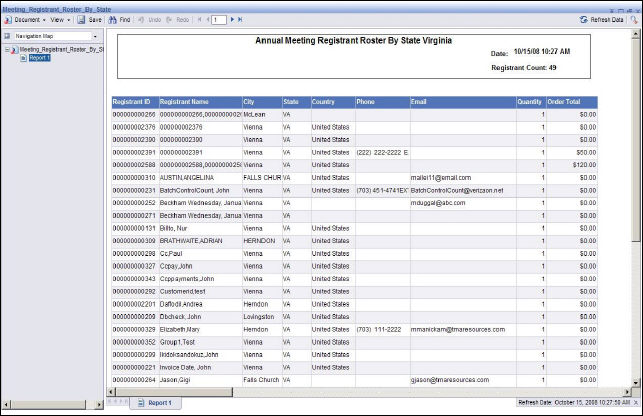
· Meeting
Registration Roster by State
This report displays the total registrants registered for the selected
meeting and selected state,
The Meeting Dashboard gets its data from the Webi reports (also called documents) listed below, which all get their data from the Meeting universe. The destination cells in the Xcelsius worksheet, into which the data from the Webi documents is mapped, are shown in the Maps To… column.
Document Name |
Universe Name |
Maps To . . . |
|---|---|---|
Future Meetings_xml |
Meeting |
Meeting List View |
Meeting Registrants Month_xml |
Meeting |
Registrants
V. Capacity Dial |
Meeting Registrants Week_xml |
Meeting |
Meeting Tab > Meeting Count by Week |
Meeting Registration All Countries_xml |
Meeting |
Map Tab > Registration By Countries list view |
Meeting Registration By State_xml |
Meeting |
Map Tab > US Map and Registration by US States list view |
Meeting Report Titles_xml |
Meeting |
Reports Tab > Reports |
Session Registrants_xml |
Meeting |
Session Tab > List View |
Top 5 Registrant Customer Class_xml |
Meeting |
Pie - Top 5 Registrants By Customer Class |