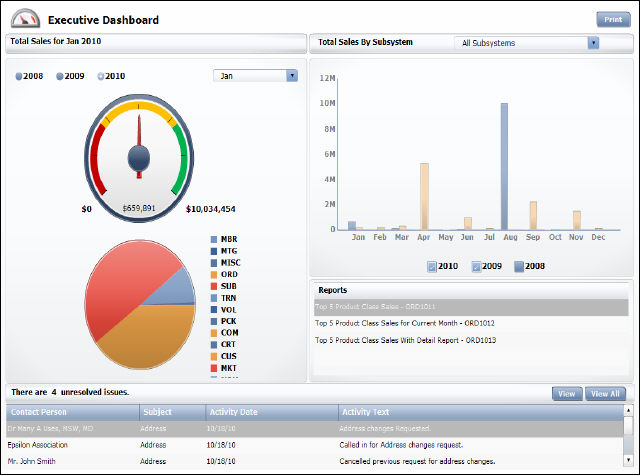
The Executive Dashboard analyzes sales using the OrderDashboard universe. The results appear in a variety of charts and graphs and outline various categories such as Total Sales for a specified month and year, Total Sales By Subsystem, Reports, and alerts.
The Total Sales for [month year] sections displays sales information for the calendar year and month selected.
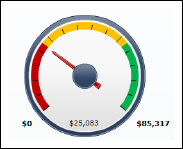
The gauge displays the total sales amount for all subsystems, for the selected month and year. Click between the current year and two previous years radio buttons and select a month from the drop-down to change the display. By default, January of the current year is selected. The total sales amount for the month and year selected is displayed inside of the gauge. The number displayed to the right of the gauge is the maximum sales total for the year selected, for all subsystems. The color of the needle on the gauge changes according to its position within the gauge.
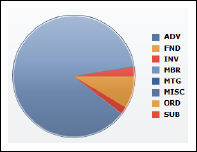
The pie chart below the gauge displays sales totals for each subsystem, according to the month and year selected. Hover your mouse over a section of the pie chart to display exact totals and percentages.
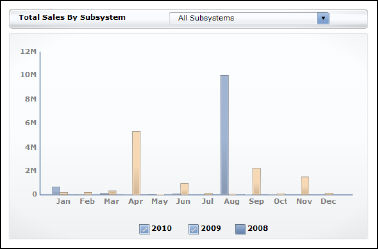
The Total Sales By Subsystem section displays a bar graph of total sales for the selected year, for all subsystems. Select a specific subsystem from the drop-down or check a different year to change the display. By default, the current and previous year checkboxes are checked. Hover your mouse over a bar in the graph to display exact totals and percentages.
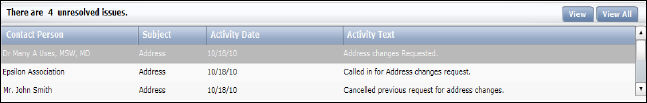
The grid at the bottom of the dashboard displays alerts regarding unresolved issues for the current user. Select the alert and click View to view more information. Click View All to display all alerts for the current user.
The Favorite Reports section displays a list of reports you selected as your favorites with a quick link to open them in another window. Please see Configuring your Favorite Data Analyzer Webi Reports for more information.
The Executive Dashboard gets its data from the Webi reports (also called documents) listed below, which all get their data from the OrderDashboard universe. The destination cells in the Xcelsius worksheet, into which the data from the Webi documents is mapped, are shown in the Maps To… column.
Document Name |
Universe Name |
Maps To . . . |
|---|---|---|
Contact Tracking_Executive_xml |
OrderDashboard |
Un-Resolved Issues (Contact Tracking) |
Executive Summary_xml |
OrderDashboard |
Total Sales By Subsystem, Dial & Pie Charts |
Report Titles_Executive |
OrderDashboard |
Reports |